Compass Intelligence, LLC
COMPASS INTELLIGENCE
  • Home
  • Services
    • Awards & Honors
    • Research Reports
    • Advisory Services
    • A-List Index >
      • A-List Index in AI Chipset
      • Fleet Tracking Index A-List Index
      • A-List Index in Asset Tracking
      • A-List Index in Smart Cities
      • Enterprise Blockchain A-List Index
      • Mobile Cloud A-List Index
      • Mobile Application Index A-List Index
    • Survey Research
    • Tracker Research
    • Event Services
    • Marketing Support
  • Research
  • Media
    • Blog
    • Press Releases
    • Webcasts & Videos
    • In the News
    • Newsletter Signup
  • About
    • Event Calendar
    • Partners & Associations

INside Mobile Blog

Q1 Wireless Carrier Results, Continued Decline in Revenue

5/30/2017

 
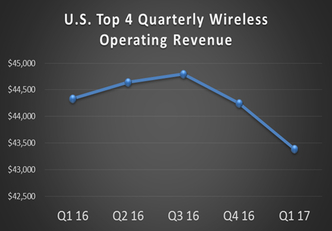
Q1 2017 and End of Year Assessment of the “Top 4 Mobile Carriers”
Who is winning and starting the year off right?
It is a busy time of year and we are still playing catch up, so we apologize for the delay in getting this update out. Compass Intelligence just completed the final assessment of Q1 2017 and the evaluation and comparisons to previous quarters in 2016 in terms of improvements and declines. We do this each quarter to understand the subscriber and share changes, as well as evaluate the key trends taking place in the wireless industry for both consumer and B2B.  We have been tracking the quarterly metrics since 2007. Some metrics are our own internal modeling and estimates, as the market does not report in all categories.  A few highlights from Q1 include:
  • Both Sprint and T-Mobile scored a 6 out of 10 improvement in key metrics, with both seeing positive net adds in both total connections and retail subscribers from Q4 2016 to Q1 2017
  • T-Mobile again dominated with total subscriber additions of 1.3M
  • Verizon had a net positive of 117K connections in Q1, while AT&T lost 666K in total connections overall
  • AT&T continues to lead in total Connected Devices (IoT and M2M) in the U.S. with 32.4M
A snapshot of Q1 2017 is below. Compass Intelligence compared last quarter’s results to this quarter to show which metrics showed improvement over others (denoted by + or -). 
Picture
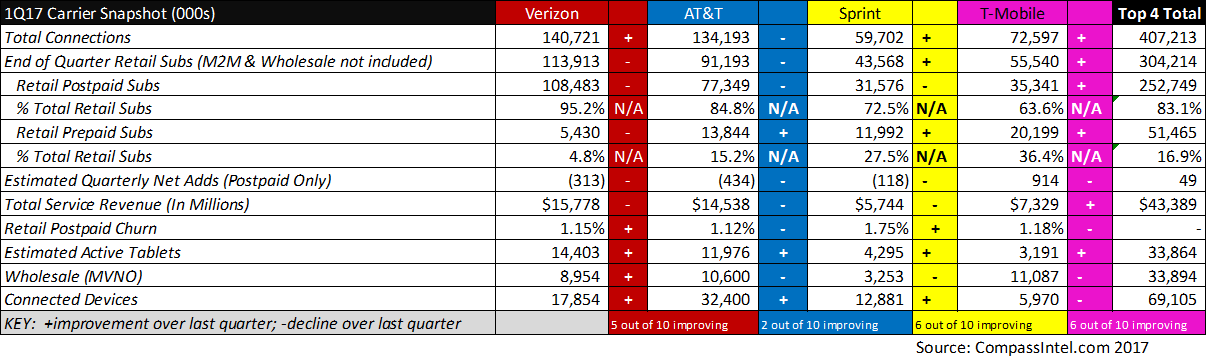
​Below are additional thoughts and insights based on the quarter and annual performance:
  • Summary:
    • The industry added 777K total connections (includes IoT and mobile subscribers),  in Q1, with an addition of 906K retail subscriber additions (half of what was added in Q4)
    • Compared to Q1 2016, Q1 2017 only added about 10%  and 33% of total connections and subscribers, representing a huge drop off to what was happening a year ago
    • Total Connections reached 407.2M by the big 4
    • Retail Subscribers for the Top 4 carriers reached 304.2M
    • A total of 1.3M tablets were activated in Q1), with Verizon adding an overall 507K just in Q4 2016 alone.
    • Based on total connections alone, AT&T and Sprint lost total market share while Verizon maintained and T-Mobile gained.
    • AT&T added 809K connected devices in Q1, reaching 32.4M total connections in Q1
 
  • REVENUE: Similar to last quarter, All carriers reported lower service revenue QoQ except for T-Mobile. (this has been a continuing theme)
    • T-Mobile increased revenue in Q1 2017 by $84M compared to Q4 2017.
    • Combined the industry experienced a loss of $862M in service revenue compared to Q4 2016
  • POSTPAID ADDS:
    • All carriers ended the quarter with negative QoQ postpaid adds, except for T-Mobile
    • T-Mobile dominated with postpaid adds, adding 914K postpaid net adds in Q1
  • CONNECTIONS:
    • Total industry connections reached 407.2M at the end of Q1 2017 for the top 4 carriers
    • Total industry subscriber base: 419.0M (Includes ALL MNOs and MVNOs)
    • Total smartphone subscribers=323.9M  
    • Total Connected Devices reached 69.1M for the industry.
As a summary, this has been a fairly poor performing quarter with the exception of T-Mobile. Now the B2B market looks completely different (contact CompassIntel.com to see what is happening in U.S. B2B). The biggest indicator is the overall drop in operating sales revenue, and watching this continue. The top 4 carriers each quarter as a whole continue to see decline in overall sales revenue, with this quarter totaling a combined $43.4B. Verizon launched “unlimited” in February, so Q2 might be interesting to see how the market responds.
Picture

Comments are closed.

    Inside Mobile

    Covering hot topics in the industry, new research, trends, and event coverage.

    Newsletter Signup
    For Email Newsletters you can trust.
    Picture

    Categories

    All
    5G
    AI
    Asset Tracking
    Autonomous
    B2B
    Big Data
    Blockchain
    Broadband
    Cable MSO
    CIO
    Connected Car/Vehicle
    Devices
    Edge Computing
    Events
    Fleet Tracking
    Internet
    Internet Of Things
    IoT
    M2M
    Mobile
    Public Safety
    Security
    Smart Cities
    Wireless

    RSS Feed

Sign up

Sign up for access to monthly newsletters, latest research, recent blogs, and more.

© 2020 Compass Intelligence, LLC. All Rights Reserved. 

Compass Intelligence, LLC
8055 State Highway 173 N
​Bandera, TX 78003


​www.compassintel.com
Picture

Contact Us 
+1 (830) 796-4498

Privacy Policy